Data Visualisation
As the old adage goes: A picture speaks a thousand words. Data visualisations are an important part of any data process or task and can help confirm or uncover insights. Any business reporting to clients, other employees, or stakeholders can make good use of data visualisations to convey a point or improve understanding. Often combined with the data summarisation process, the summarised data can be visually represented to give some initial insights to the data, or more specific data visualisations can be generated showing snapshots of the dataset.
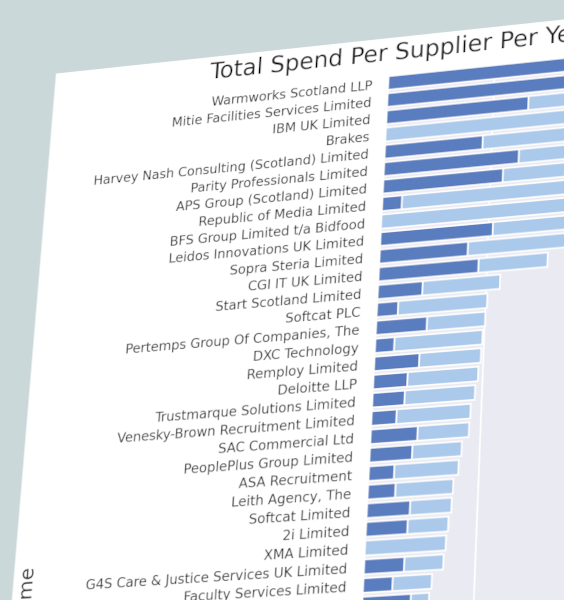
T3Data uses many methods to produce professional and customisable visualisations, whether for a formal report, presentation, or for inclusion into a dashboard.